Searches for photo booth rentals have grown substantially over the past decade. See how many people are searching for photo booth rentals, DJ services, and Wedding Photographers each month in the 50 largest cities across the United States and Canada with this infographic. Scroll down to the end of it to see how searches for each of these three services have trended over the past 10 years.
How to Read This Infographic
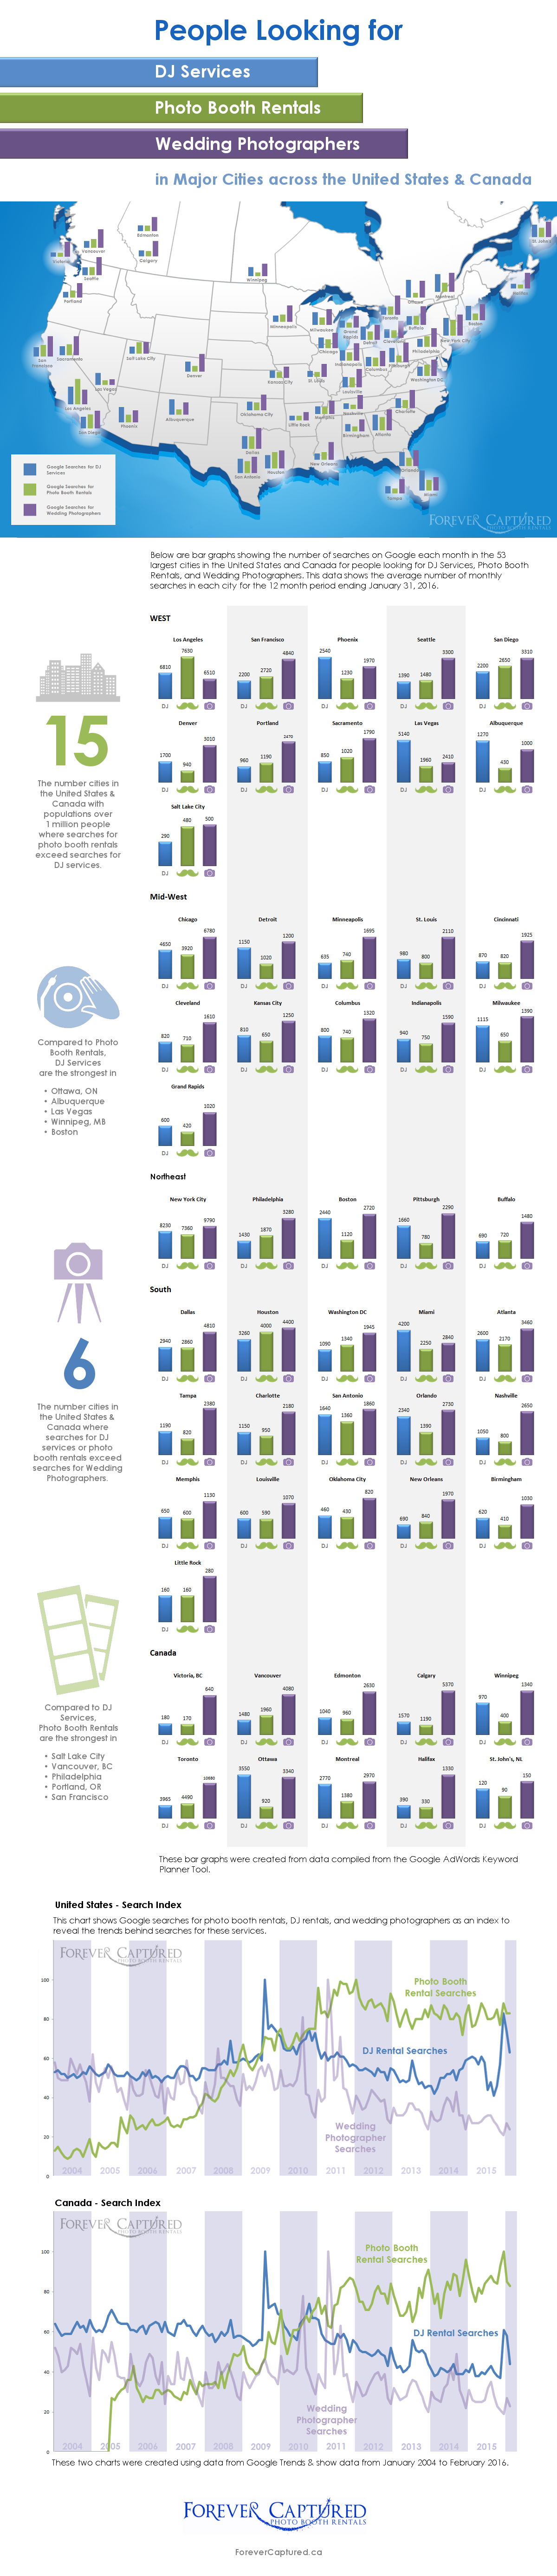
 This infographic shows the average number of searches on Google for DJ services, photo booth rentals, and Wedding Photographers in more than 50 major cities across the United States and Canada.
To understand the infographic, start with the map of the United States and Canada at the very top. As you look across the continent on the map, you will see three vertical bar for each city. The blue bar represents the monthly average number of searches for DJ services. The green bar represents searches for photo booth rentals, and the purple bar represents Wedding Photographer searches. The map is useful for quickly finding your city and comparing it to other cities you are familiar with.
To get a better idea of how two cities compare, look below the map at the vertical bars for each city. All cities are grouped according to 5 regions: West, Mid-West, Northeast, South, and Canada.
Above the vertical bars in this section are color coded in the same way they are in the map. The difference in this city section is that the bars have numbers over top of them to show the average number of searches per month that we were able to glean from Google. Using these numbers, you can accurately compare the volumes of monthly searches that are taking place in different cities (you can’t compare cities using the vertical bars in the map because the three bars for each city are only drawn in relation to each other. They are not drawn in proportion to other cities).
Trends
 The charts near the bottom of the infographic show the overall trends for people searching for photo booth rentals, DJ services, and Wedding Photographers in the United States and Canada. This data is extracted from Google Trends. They show search trends as an index. For the U.S. index, you can see that searches for Wedding Photographers are roughly half of what they were 12 years ago. Searches for DJs have jumped around a fair bit, but overall they’re roughly holding their ground. Searches for photo booth rentals grew rapidly for the 7 year period of 2005 to 2012 but seem to have stabilized over the past 4 years. The Canadian index, on the other hand, shows what is happening in many countries around the world: searches for photo booths are still growing. However, searches for DJ services in Canada have declined as searches for photo booth rentals have grown.
Copying or Using this Infographic
If you wish to post this infographic or any of the images on this page on your website, feel free to do so. We just request that you link back to this website as the source. You can also use the code below to embed the infographic on a webpage.
Embed This Image On Your Site (copy code below):